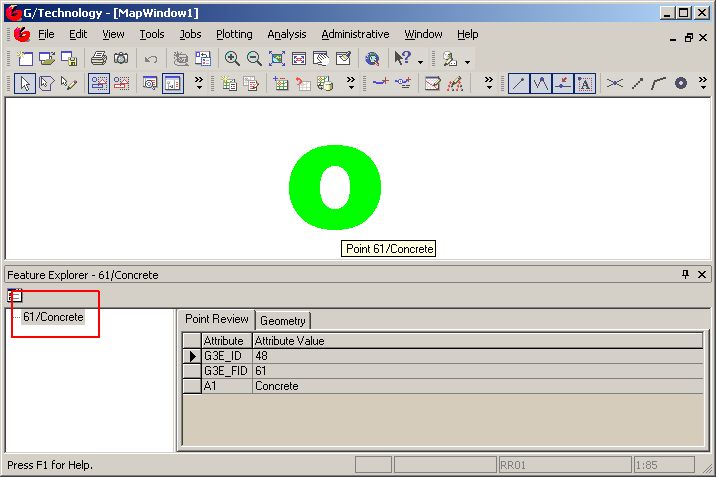
Stephan Deckers

Don’t use import-css directives when bundling

Consider the following code:

public ActionResult Index( )
{
  StyleBundle b = new StyleBundle( "~/b1");
  b.Include( "~/Content/base.css");
  BundleTable.Bundles.Add( b);
  return( View( "~/Src/b.cshtml"));
}

This Controller method creates a bundle and includes a css-file located at ~/Content/base.css and then returns the view. The css file looks like this :

@import "b2.css";
body
{
  font-family: Verdana;
  font-size: small;
}

This file imports another css file b2.css. This includes a style to render the ‘important’-div red:

#important
{
  color: #FF0000;
}

The last line in our C#-code renders file ~/Src/b.cshtml :

@System.Web.Optimization.Styles.Render( "~/b1")
<div id="important">This is important</div>

This file calls the Render from System.Web.Optimization.Styles. The purpose of the Optimization library is to minimize css-files and scripts when running a release build, saving you the hassle of manually creating minimized files. If you call on this Action in Visual Studio, optimisation is disabled because you’re running in debug-mode resulting in the following view :

result in debug mode

result in debug mode

You see a nice red sentence, just like expected. If you now publish a release build of this code, you’ll see the following :

release-mode

release-mode

The red sentence has turned black. What happened ? If you inspect the network traffic using F12-network, you see the following :

release-build traffic

release-build traffic

The imported css file is not found on the network, caused by optimisation failing to fetch the correct paths for imported css files.

Ergo : Don’t use bundling with imported css-files.

If in full control of your css-files, then don’t import css files using the ‘import’-directive. If you’re not in control of your css files (using jQuery, Openlayers, etc..) then don’t optimize your css files using bundling.

Notes:

  1. Optimisation failing isn’t noticed until you deploy a release build. Even if you run a release build local before deploying, a cached css maybe read thus fooling you. If you would inspect network traffic on a release build locally before deploying, you’d see it fails
  2. Optimization is turned on by the following line in Web.Config :
    <compilation debug="false" targetFramework="4.0"/>
    

    If you publish a release build, the attribute debug="false" is absent which results in ASP.Net using the default which is false:

    <compilation targetFramework="4.0"/>
    
  3. To quickly see if your optimized styles are rendering correct, you can also use the following statement in your C#-code :
    BundleTable.EnableOptimizations = true;
    

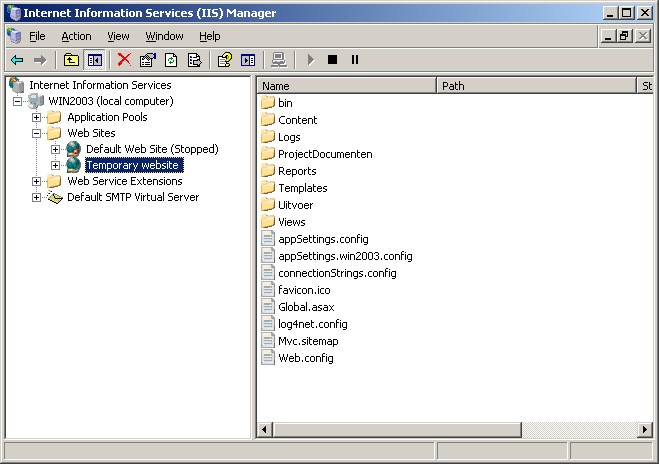
Using SSL during a certificate request

Creating a temporary website

If you need to request a certificate to use for a website, you need to generate a certificate request resulting in a certreq.txt you need for buying the actual certificate. Once the certreq.txt is generated, you can not use another certificate for your website because your request is still pending. The below figure shows the dialog you’ll see when trying to setup secure connections for a website for which a certificate request is pending:

request-pending

request-pending

There can be days, even weeks between the actual request for buying a certificate and the moment it is delivered, which voids SSL-communications for your website. To avoid this, you can create a new website, then use a development certificate and use that for your site until your actual certificate is delivered.

Creating a temporary website

Creating a temporary website

If your actual certificate is delivered, you need to delete your temporary website and you can use the actual certificate.

Intergraph issues database will be public available

Intergraph has an internal database for keeping track of all kinds of software issues, if you file a Trouble- or Change Request, it will end up in this database. This database will become public available in the 3rd quarter of 2013 according to Intergraph sources at Hexagon 2013. Also, if a problem gets fixed, the solution will be described so you know if applies to you. All this information will be public accessible and indexed by Google, so if you are facing a problem in G/Technology (or any other Intergraph product) google will find it and it will show up in the results of your search.

Netviewer extensions

It doesn’t take much to create a Netviewer extension:

  1. Derive a class from Microsoft.Practices.CompositeUI.ModuleInit
  2. Create a constructor with a [ServiceDependency()] WorkItem argument
  3. Modify your ProfileCatatalog.xml

The class would look like this:

namespace NetviewerLibrary
{
	#region -- Using directives --
	using System;
	using System.Reflection;
	using Microsoft.Practices.CompositeUI;
	using d = System.Diagnostics.Debug;
	#endregion

	public class Init: ModuleInit
	{
	    public Init([ ServiceDependency()] WorkItem rootWorkItem)
	    {
		   d.WriteLine( "Init");
	    }
	}
}

This code is using a pattern from the Microsoft Enterprise Library version 2.0 (no longer supported by Microsoft) for setting up an external library to be invoked by an application. The external library in this case is your extension, the application is Netviewer. All it takes for Netviewer to invoke the extension is a class derived from Microsoft.Practices.CompositeUI.ModuleInit and create a constructor with an Microsoft.Practices.CompositeUI.ServiceDependency argument. In line 10 a Microsoft.Practices.CompositeUI.ModuleInit-derived class is declared and at line 12 you can see the constructor. If your extension is compiled to an assembly called ‘NetviewerLibrary1’, you include your extension in the ProfileCatalog.xml file and add your command to IngrViewer.exe.config, Netviewer will invoke your extension.

This is the ProfileCatalog.xml :

<SolutionProfile xmlns="http://schemas.microsoft.com/pag/cab-profile/2.0">
  <Section Name="Apps">
    <Modules>
      <ModuleInfo AssemblyFile="GTechnology" />
      <ModuleInfo AssemblyFile="NetviewerCommand.dll" />
    </Modules>
  </Section>
</SolutionProfile>

This is not very useful other then illustrating what it takes for Netviewer to invoke your extension. Netviewer works with commands, and each extension can have one more or of it. The ProfileCatalog.xml is where you define your extensions, the IngrViewer.exe.config is where you define your commands. In order to do something useful, we need to add our command to IngrViewer.exe.config and extend our code with a command handler:

This is the line in IngrViewer.exe.config which adds the command:

<command name="NetviewerCommand1" autocreate="true" tooltip="NetviewerCommand1" label="CustomCommand1" />

This is the code:

namespace NetviewerLibrary
{
  #region -- Using directives --
  using System;
  using System.Reflection;
  using Microsoft.Practices.CompositeUI;
  using Microsoft.Practices.CompositeUI.Commands;
  using Intergraph.OneMobile.Infrastructure.Interface;
  using d = System.Diagnostics.Debug;
  #endregion

	public class Init: ModuleInit
	{
		public WorkItem WorkItem{   get; set;   }

		public Init([ ServiceDependency()] WorkItem rootWorkItem)
		{
			d.WriteLine( "Init");
			this.WorkItem = rootWorkItem;
		}

		public override void Load()
		{
			d.WriteLine( "Load");

			base.Load();

			ControlledWorkItem workItem = this.WorkItem.WorkItems.AddNew();
			workItem.Controller.Run();
		}
	}

	public partial class MyController :
		Intergraph.OneMobile.Infrastructure.Interface.WorkItemController
	{
		[ CommandHandler( "NetviewerCommand1")]
		public void MyCommand_Handler( object sender, EventArgs eventArgs)
		{
			d.WriteLine( "MyCommand_Handler");
		}
	}
}

If you now run Netviewer, there will be an extra button with a label “NetviewerCommand1” and if you click it, your commandhandler will be invoked.

Netviewer command

Netviewer command

Now let’s turn this extension in something useful, for instance placing a pinpoint. We want our command to ask the user to click in the Window and then place a pinpoint at the cursur. To do so, we need to extend our code with the following:

  1. A reference to the Netviewer MapviewService instance for setting up eventhandlers
  2. A Commandhandler for a left-mouse click
  3. Infrastructure code

The modified code looks like this:

namespace NetviewerLibrary
{
  #region -- Using directives --
  using System;
  using System.Reflection;
  using Microsoft.Practices.CompositeUI;
  using Microsoft.Practices.CompositeUI.Commands;
  using Microsoft.Practices.CompositeUI.EventBroker;
  using Intergraph.OneMobile.Infrastructure.Interface;
  using Intergraph.OneMobile.Map.Interface.Constants;
  using Intergraph.OneMobile.Map.Services;
  using Intergraph.Controls.oneViewer;
  using d = System.Diagnostics.Debug;
  #endregion

  public static class Global
  {
    public static int CallCount {   get; set;   }
  }

 public class Init: ModuleInit
 {
    public WorkItem WorkItem      {   get; set;   }

      public Init([ ServiceDependency()] WorkItem rootWorkItem)
      {
        d.WriteLine( string.Format( "{0}.{1} ({2}):{3}", GetType().Name, System.Reflection.MethodInfo.GetCurrentMethod().Name, Global.CallCount++, string.Empty));

        this.WorkItem = rootWorkItem;
      }

      public override void Load()
      {
        d.WriteLine( string.Format( "{0}.{1} ({2}):{3}", GetType().Name, System.Reflection.MethodInfo.GetCurrentMethod().Name, Global.CallCount++, string.Empty));

        base.Load();

        ControlledWorkItem workItem = this.WorkItem.WorkItems.AddNew();
        workItem.Controller.Run();
      }
  }

  public partial class MyController :
    Intergraph.OneMobile.Infrastructure.Interface.WorkItemController
  {
    #region -- Properties --
    public IMapViewService  MapviewService    {   get; set; }
    public string      OldMapLocateMode  {   get; set; }
    #endregion

    [ CommandHandler( "NetviewerCommand1")]
    public void MyCommand_Handler( object sender, EventArgs eventArgs)
    {
      d.WriteLine( string.Format( "{0}.{1} ({2}):{3}", GetType().Name, System.Reflection.MethodInfo.GetCurrentMethod().Name, Global.CallCount++, string.Empty));

      this.MapviewService.SetStatusBar( "Click to place pinpoint");

      SwitchMapMode  ( );
      SetupEventSink  ( );
    }

    [ EventSubscription( EventTopicNames.MapViewLoaded)]
    public void MapViewLoaded_Handler( object sender, EventArgs eventArgs)
    {
        d.WriteLine( string.Format( "{0}.{1} ({2}):{3}", GetType().Name, System.Reflection.MethodInfo.GetCurrentMethod().Name, Global.CallCount++, string.Empty));

        this.MapviewService = WorkItem.Services.Get();
    }

    private void SwitchMapMode( )
    {
      d.WriteLine( string.Format( "{0}.{1} ({2}):{3}", GetType().Name, System.Reflection.MethodInfo.GetCurrentMethod().Name, Global.CallCount++, string.Empty));

      this.OldMapLocateMode = this.MapviewService.GetMapMode( );
      this.MapviewService.SetMapMode( Intergraph.Controls.oneViewer.MapModes.Custom);
    }

    private void SetupEventSink( )
    {
      d.WriteLine( string.Format( "{0}.{1} ({2}):{3}", GetType().Name, System.Reflection.MethodInfo.GetCurrentMethod().Name, Global.CallCount++, string.Empty));

      this.MapviewService.RedlineLButtonDown    += new Intergraph.Controls.oneViewer.RedlineButtonEventHandler( MapviewService_RedlineLButtonDown );
    }

    void MapviewService_RedlineLButtonDown( object sender, Intergraph.Controls.oneViewer.RedlineButtonEventArgs e )
    {
      d.WriteLine( string.Format( "{0}.{1} ({2}):{3}", GetType().Name, System.Reflection.MethodInfo.GetCurrentMethod().Name, Global.CallCount++, string.Empty));

      string  point    = string.Format( "{0}, {1}", e.XWorldPos, e.YWorldPos);
      string  pointType  = "UOR";
      string  fontName  = "G_MapPins";
      short  fontSize  = 24;
      string  fontColor  = "FF0000"; // --- Red
      string  charValue  = "F";    // --- Solid filled push pin

      this.MapviewService.PlaceLocationPinAtPoint(
                    point,
                    pointType,
                    fontName,
                    fontSize,
                    fontColor,
                    charValue,
                    "POI");
      StopCommand( );
    }

    private void StopCommand()
    {
      d.WriteLine( string.Format( "{0}.{1} ({2}):{3}", GetType().Name, System.Reflection.MethodInfo.GetCurrentMethod().Name, Global.CallCount++, string.Empty));

      RestoreMapMode  ( );
      ReleaseEventSink( );

      this.MapviewService.SetStatusBar( string.Empty);
   }

    private void RestoreMapMode( )
    {
      d.WriteLine( string.Format( "{0}.{1} ({2}):{3}", GetType().Name, System.Reflection.MethodInfo.GetCurrentMethod().Name, Global.CallCount++, string.Empty));

      this.MapviewService.SetMapMode( this.OldMapLocateMode);
    }

    private void ReleaseEventSink( )
    {
      d.WriteLine( string.Format( "{0}.{1} ({2}):{3}", GetType().Name, System.Reflection.MethodInfo.GetCurrentMethod().Name, Global.CallCount++, string.Empty));

      this.MapviewService.RedlineLButtonDown -= new Intergraph.Controls.oneViewer.RedlineButtonEventHandler( MapviewService_RedlineLButtonDown );
    }
  }
}

After running this command, a pinpoint is placed to indicate some point of interest :

pinpoint

pinpoint

You can download the complete source for this example over here.

Deploying an MVC4 Web application to Windows 2003

I had a hard time deploying an MVC4 application to Windows server 2003, so I thought I’d share my experience with you.
When deploying an MVC4-based website to Windows Server 2003, it is important to add Wildcard maps in Internet Information Services (IIS). The default IIS-configuration is based on extensions coupled to ISAPI-addins, but MVC doesn’t work with extensions so you need to tell IIS to have a ‘catch-it all’ extension. Here are the steps necessary to do so.

The target framework needs to be 4.0

If you develop a MVC4 website using Visual Studio 2012, the default .NET framework is 4.5. Windows 2003 doesn’t support the .NET framework 4.5 as you can read over here, so you need to downgrade the target framework to 4.0. You can easily do this with Visual Studio 2012 by changing the target framework in your project properties pages :

Target framework Visual Studio 2012 project

Target framework Visual Studio 2012 project

Installing the .Net 4 framework

The next step is to install the .NET framework 4.0. This comes in two flavours, the .NET 4 Framework Client Profile and the .NET 4 Framework which is the full framework. If you are deploying webapplications, you need the full framework, the Client Profile is a subset of the framework for desktop applications. You can read more about the differences over here. You can download the full redistributable of the .Net framework 4.0 at microsoft. After you installed the .NET 4.0 framework, you’ll see the following listing in installed programs :

.NET 4 framework installed

.NET 4 framework installed

The .NET 4 Framework Client Profile is the subset of the framework, the .NET 4 Framework Client Extended is the remainder making the full framework to be installed.

Configuring IIS to use .Net 4

After .NET 4 is installed, it is registered to IIS as an Web Service Extension, but it is not enabled by default:

ASP.Net 4.0 prohibited

ASP.Net 4.0 prohibited

Right click the ASP.Net v4.0.30319 line and select Allowed. After that, you should see the following screen :
ASP.Net 4.0 allowed

ASP.Net 4.0 allowed

Adding a Wildcard map

If you are deploying Web-Forms applications, then your done and your application should run. If you are working on MVC applications there’s one last step to do, you need to add a Wildcard map for your application. Go to IIS, select your project and choose Properties→Virtual Directory→Configuration and you’ll see the Application Configuration screen. In the lower part you can see a listing of installed wild card application maps, which is empty. You can add one by selecting the ‘Insert’ button:

Insert wildcard IIS map Virtual Directory

Insert wildcard map IIS Virtual Directory


The ‘Add/Edit Application Extension Mapping’ dialog shows up. In the Executable-text field, enter the path to the .NET Framework 4.0 isapi-extension which is normally c:\Windows\Microsoft.NET\Framework\v4.0.30319\aspnet_isapi.dll. Be sure to unselect the ‘Verify that file exist’-checkbox :

Add IIS wildcard

Add IIS wildcard


Choose ‘OK’ and close the screen. Your dialog should now look like this :
IIS Wildcard added

IIS Wildcard added


Close the screen, and your MVC4 application should now be ready to run!

Debugging Netviewer serverside pages

If you need to build server side pages in Netviewer, changes are likely that you want to debug them. First thing to do is to change the output-path of your assembly to C:\Program Files\Intergraph\GTechnology\Program\GViewerApp\bin like in the following figure:

Visual Studio output path

This figure shows the properties page of a project, and while the path isn’t complete visible, it should be C:\Program Files\Intergraph\GTechnology\Program\GViewerApp\bin, the bin folder of your application. Next step to do is make sure that the aspx-page in the GViewerApp folder matches the one in your project. You can either copy it or even better create a symbolic link to your original source using the fsutil command (see notes for an example). If you now start a debug session using F5, your breakpoints won’t be hit because you are using the Visual Studio built in webserver which uses an url like http://localhost:1399/ and Netviewer is using IIS. You can check the url netviewer client is using is by entering a string like http://G01/GViewer directly into Internet Explorer, where G01 should be replaced by your server. If you entered the right url, the following screen shows up :

Intergraph Netviewer client url from Internet Explorer

netviewer from ie

If you then select ‘OK’, Netviewer client will start. In order to debug your serverside pages, you need to attach the debugger to the process which is serving http://G01/GViewer. This is process ‘w3pw.exe’ running with credentials as set in your application pool :

Intergraph Netviewer application pool

Netviewer application pool

The process to attach to is the w3wp.exe executable running with the credentials as set in the IIS application pool :

Visual Studio attach to process

Attach to process

As you can see, the username matches the identity in my application pool which is G01\Stephan. If you now start a debug session, breakpoints probably won’t be hit because there are some more steps we need to take care off. The next step is enable debugging in IIS :

Enable debugging Internet Information Services Windows Server 2003

Enable debugging IIS

This figure shows the ‘Configuration’ dialog of the GViewer-IIS node. You can reach this by opening Internet Information Services (IIS), right mouse click the GViewer Virtual Directory, select the ‘Virtual Directory’-tab and then select the ‘Configuration’-tab which shows the ‘Application Configuration’ dialog. Make sure you select both checkboxes in the ‘Debugging flags’ section.
We also need to let ASP.Net compile webpages with debugging enabled. For IIS, ASP.Net is just a plugin to handle pages with an .aspx extension and it’s configuration is apart from IIS. In order for ASP.Net to generate debugging symbols when your pages are compiled, you need to add the following line to Web.Config located in
C:\Program Files\Intergraph\GTechnology\Program\GViewerApp, just after the system.web node:

<system.web>
  <compilation debug="true" />
</system.web>

Debugging should now work. If you select button ‘Attach’ from the ‘Attach to process’ screen, invoke a clientside function which posts back to your server page your breakpoints should be hit :

Breakpoint hit Netviewer aspx page

Breakpoint hit Netviewer aspx page

The ‘Single File Page’ model

One thing which also might help is to develop your ASPX-pages with all your server-side code in the aspx page itself. That way, you don’t need to place a custom dll in the GViewerApp bin folder and temper with it. This technique is called the Single File Page Model, an aspx-page using this technique looks like this :

<%@ Page Language="C#" %>

<script type="text/C#" runat="server">
    protected void Page_Load(object sender, EventArgs e)
    {
        System.Diagnostics.Debug.WriteLine("Page_Load");
    }

    protected void Button1_Click(object sender, EventArgs e)
    {
        this.Label1.Text = "Netviewer Rocks!";
    }
</script>
<html xmlns="http://www.w3.org/1999/xhtml">
<head runat="server">
    <title></title>
</head>
<body>
    <form id="form1" runat="server">
    <div>
    
    </div>
        <asp:Button ID="Button1" runat="server" OnClick="Button1_Click" Text="Button" />
        <asp:Label ID="Label1" runat="server" Text="Label"></asp:Label>
    </form>
</body>
</html>

You need to place this file in the GViewerApp folder. If you now attach Visual Studio to process ‘w3wp.exe’ and open your .aspx file, your breakpoints will be hit :

Breakpoint hit single file model Intergraph Netviewer server

Breakpoint hit single file model

In my experience, that’s the most convenient way to debug ASPX pages. You just need to place the .aspx-page in the GViewerApp folder, attach Visual Studio to the w3wp.exe process and you’re ready to go. You can also change code in the aspx without having to restart the server, ASP.Net will recompile it runtime.

Troubleshooting

  • If using the code-behind model, you might need to restart GNetviewer for the breakpoints to be hit and to be able to overwrite files in the GViewerApp\bin folder
  • If the process ‘w3pw.exe’ doesn’t show up in the process list and Netviewer is started, there is no session yet. You need to start Netviewer client for new HTTP requests to be send to IIS which will start a new worker process ‘w3wp.exe’. This is your new session.
  • In order to quickly see if your breakpoints are hit, you can enter a url like http://g01/GViewer/QuickSearch.aspx directly in Internet Explorer. If you then select a button causing a postback and your environment is setup right, breakpoints are hit and you can step through your code
  • When attaching the debugger, you may need to select the type of code to debug. Visual Studio doesn’t always select the right type :
    Select code type to debug

    Select code type to debug

  • If you have a aspx-page outside of the GViewerApp application, you need to copy it for your changes to take effect, which leaves you with 2 versions of a file. You can avoid this by creating a symbolic link from your copy to your source :
    $fsutil hardlink create DekkingsProfiel.aspx "C:\Users\Stephan\Wrk\sde01_one\Gasunie\Ga
    sUnie.NetViewer.Dekkingsprofiel\Pages\DekkingsProfiel.aspx"

    Windows now creates a symbolic link to your source-aspx, and it looks like there are 2 seperate aspx-files, but if you edit either one of them both are changed since there’s really only one version. This way, the version in in GViewerApp always matches your development version.