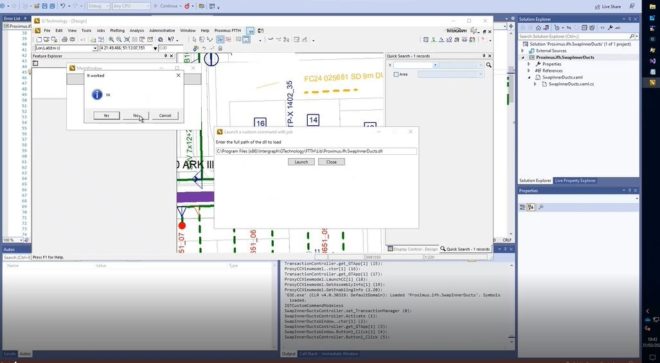
If you need to build server side pages in Netviewer, changes are likely that you want to debug them. First thing to do is to change the output-path of your assembly to C:\Program Files\Intergraph\GTechnology\Program\GViewerApp\bin like in the following figure:
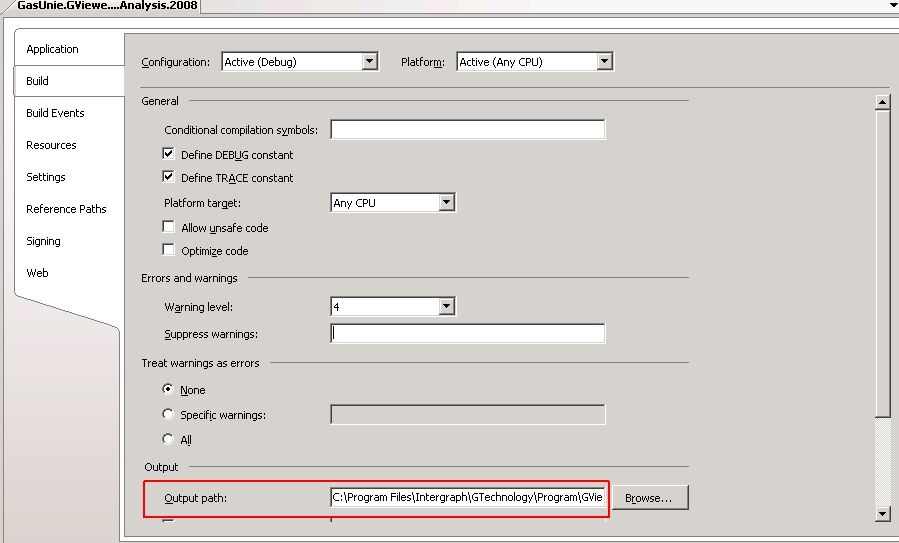
This figure shows the properties page of a project, and while the path isn’t complete visible, it should be C:\Program Files\Intergraph\GTechnology\Program\GViewerApp\bin, the bin folder of your application. Next step to do is make sure that the aspx-page in the GViewerApp folder matches the one in your project. You can either copy it or even better create a symbolic link to your original source using the fsutil command (see notes for an example). If you now start a debug session using F5, your breakpoints won’t be hit because you are using the Visual Studio built in webserver which uses an url like http://localhost:1399/ and Netviewer is using IIS. You can check the url netviewer client is using is by entering a string like http://G01/GViewer directly into Internet Explorer, where G01 should be replaced by your server. If you entered the right url, the following screen shows up :
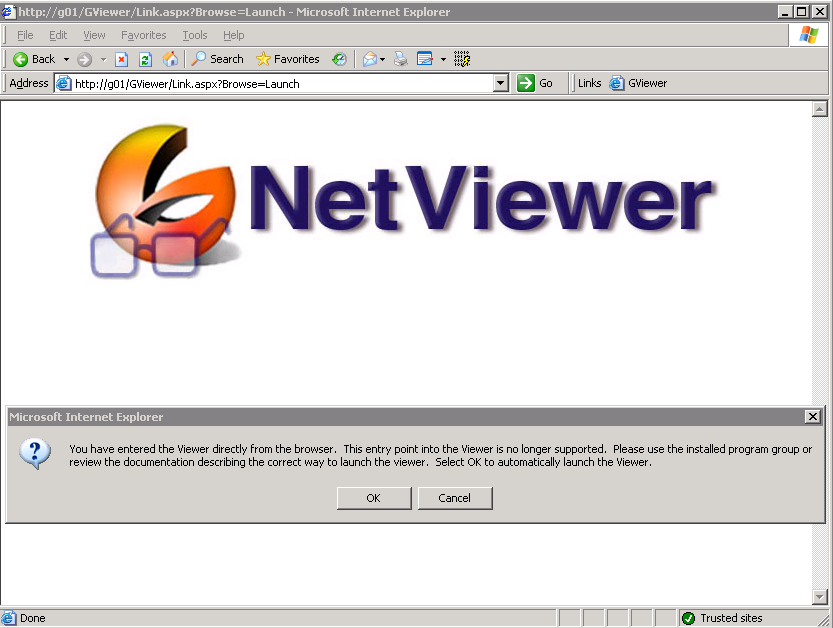
If you then select ‘OK’, Netviewer client will start. In order to debug your serverside pages, you need to attach the debugger to the process which is serving http://G01/GViewer. This is process ‘w3pw.exe’ running with credentials as set in your application pool :
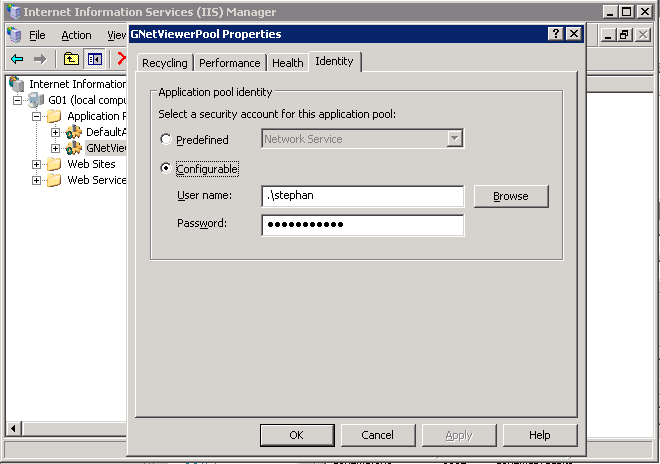
The process to attach to is the w3wp.exe executable running with the credentials as set in the IIS application pool :
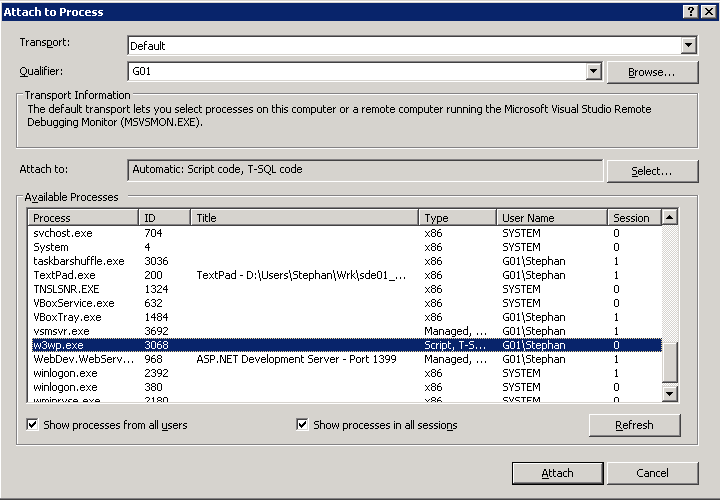
As you can see, the username matches the identity in my application pool which is G01\Stephan. If you now start a debug session, breakpoints probably won’t be hit because there are some more steps we need to take care off. The next step is enable debugging in IIS :
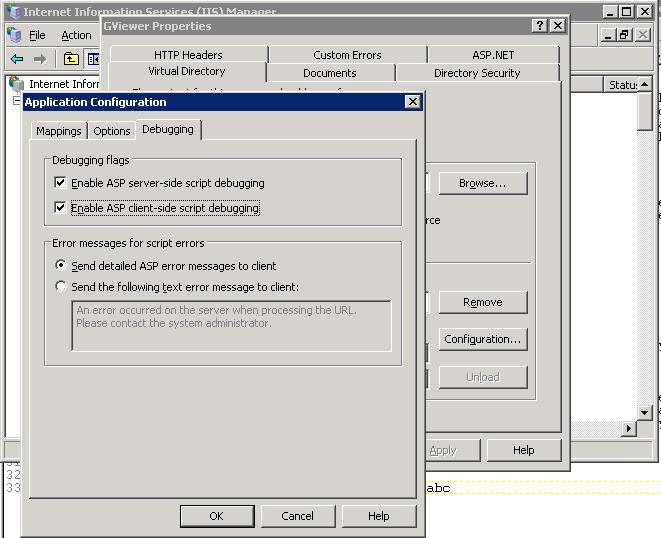
This figure shows the ‘Configuration’ dialog of the GViewer-IIS node. You can reach this by opening Internet Information Services (IIS), right mouse click the GViewer Virtual Directory, select the ‘Virtual Directory’-tab and then select the ‘Configuration’-tab which shows the ‘Application Configuration’ dialog. Make sure you select both checkboxes in the ‘Debugging flags’ section.
We also need to let ASP.Net compile webpages with debugging enabled. For IIS, ASP.Net is just a plugin to handle pages with an .aspx extension and it’s configuration is apart from IIS. In order for ASP.Net to generate debugging symbols when your pages are compiled, you need to add the following line to Web.Config located in
C:\Program Files\Intergraph\GTechnology\Program\GViewerApp, just after the system.web node:
<system.web>
  <compilation debug="true" />
</system.web>
Debugging should now work. If you select button ‘Attach’ from the ‘Attach to process’ screen, invoke a clientside function which posts back to your server page your breakpoints should be hit :
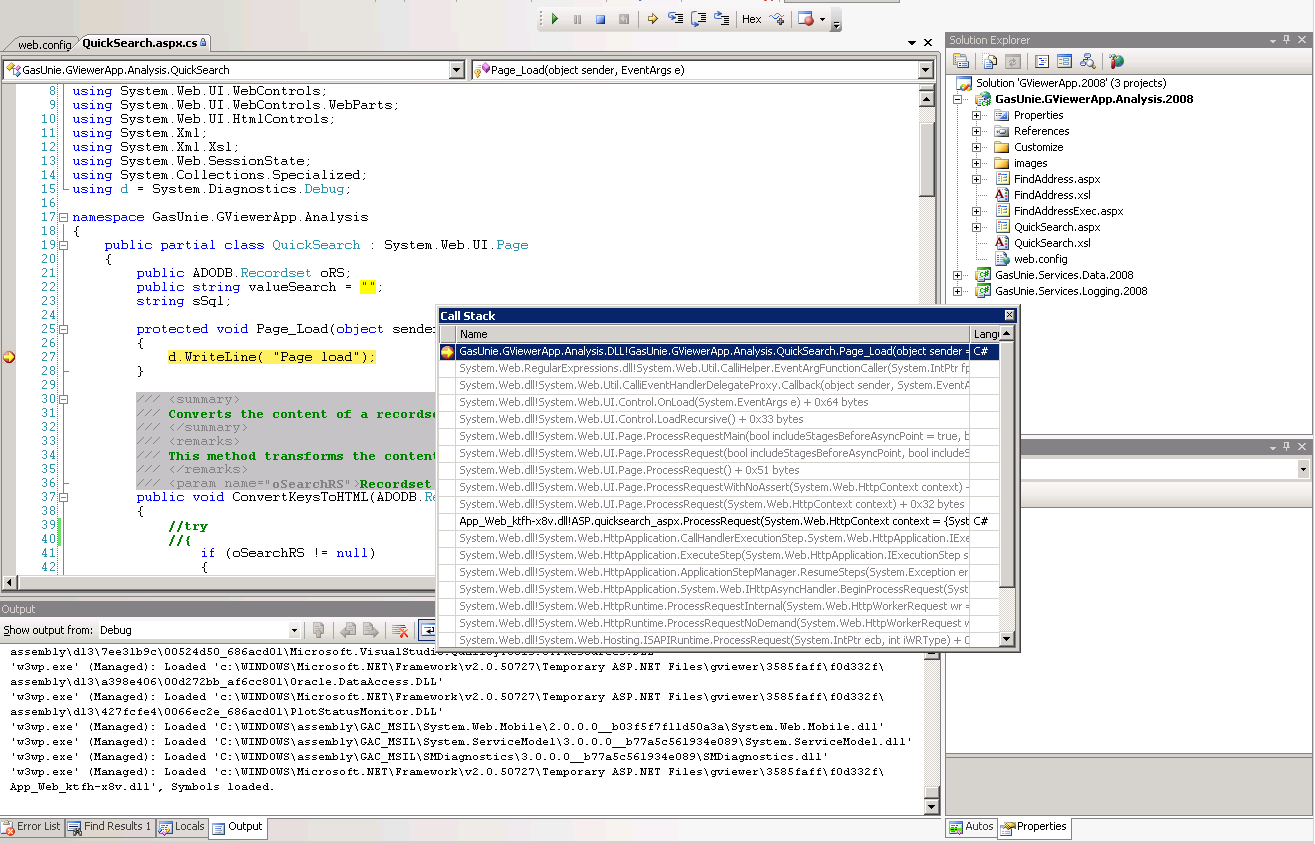
The ‘Single File Page’ model
One thing which also might help is to develop your ASPX-pages with all your server-side code in the aspx page itself. That way, you don’t need to place a custom dll in the GViewerApp bin folder and temper with it. This technique is called the Single File Page Model, an aspx-page using this technique looks like this :
<%@ Page Language="C#" %>

<script type="text/C#" runat="server">
    protected void Page_Load(object sender, EventArgs e)
    {
        System.Diagnostics.Debug.WriteLine("Page_Load");
    }

    protected void Button1_Click(object sender, EventArgs e)
    {
        this.Label1.Text = "Netviewer Rocks!";
    }
</script>
<html xmlns="http://www.w3.org/1999/xhtml">
<head runat="server">
    <title></title>
</head>
<body>
    <form id="form1" runat="server">
    <div>

    </div>
        <asp:Button ID="Button1" runat="server" OnClick="Button1_Click" Text="Button" />
        <asp:Label ID="Label1" runat="server" Text="Label"></asp:Label>
    </form>
</body>
</html>
You need to place this file in the GViewerApp folder. If you now attach Visual Studio to process ‘w3wp.exe’ and open your .aspx file, your breakpoints will be hit :
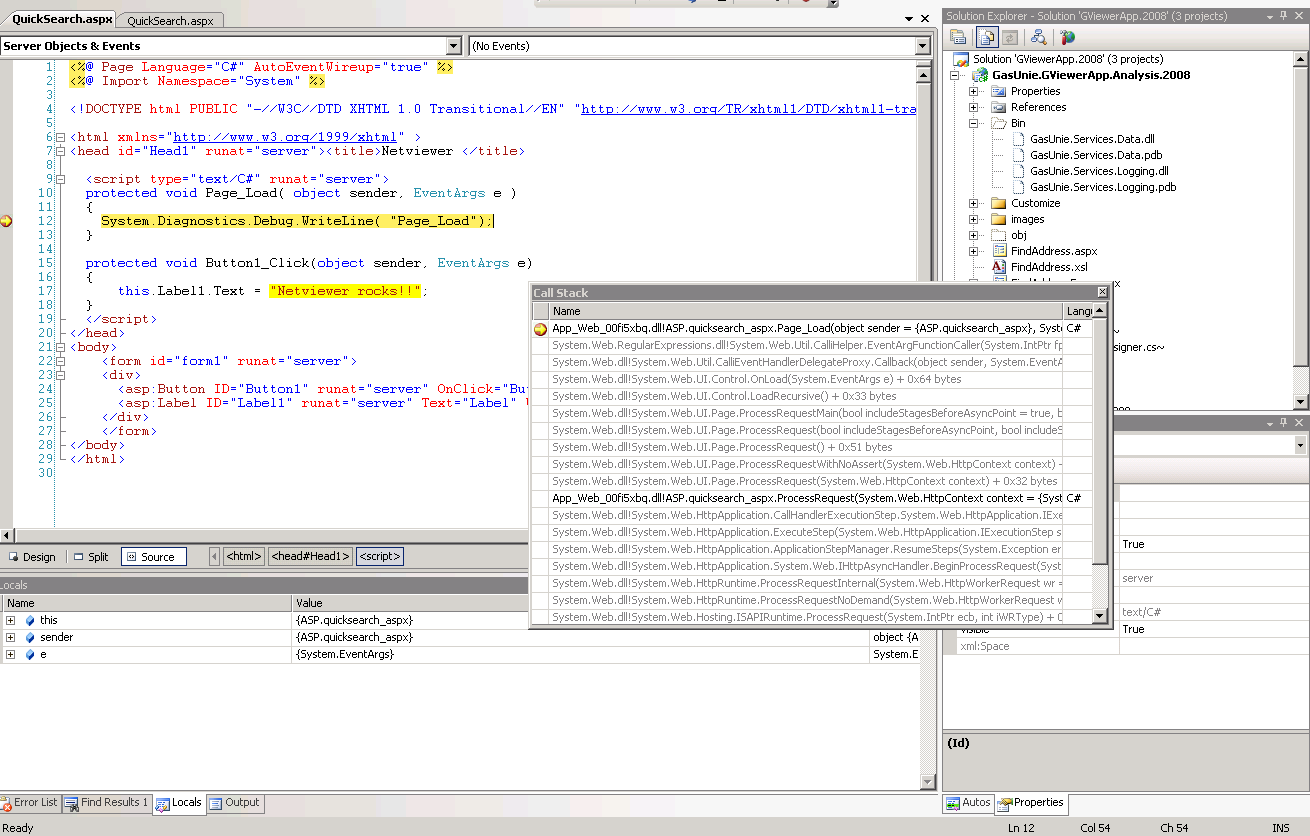
In my experience, that’s the most convenient way to debug ASPX pages. You just need to place the .aspx-page in the GViewerApp folder, attach Visual Studio to the w3wp.exe process and you’re ready to go. You can also change code in the aspx without having to restart the server, ASP.Net will recompile it runtime.
Troubleshooting
- If using the code-behind model, you might need to restart GNetviewer for the breakpoints to be hit and to be able to overwrite files in the GViewerApp\bin folder
- If the process ‘w3pw.exe’ doesn’t show up in the process list and Netviewer is started, there is no session yet. You need to start Netviewer client for new HTTP requests to be send to IIS which will start a new worker process ‘w3wp.exe’. This is your new session.
- In order to quickly see if your breakpoints are hit, you can enter a url like
http://g01/GViewer/QuickSearch.aspxdirectly in Internet Explorer. If you then select a button causing a postback and your environment is setup right, breakpoints are hit and you can step through your code - When attaching the debugger, you may need to select the type of code to debug. Visual Studio doesn’t always select the right type :
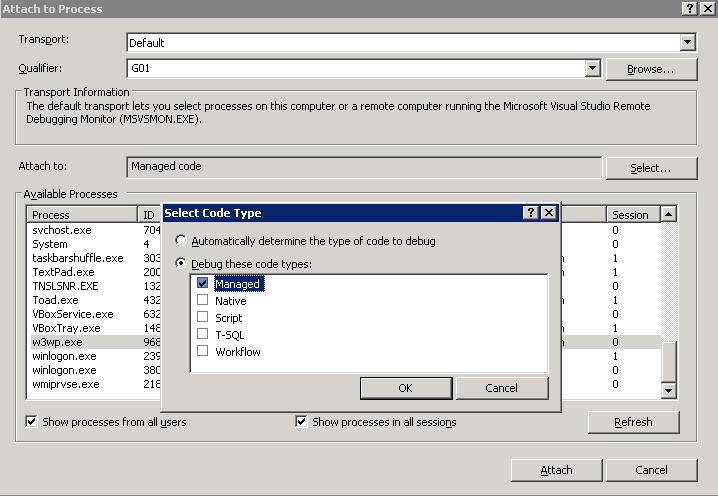
Select code type to debug - If you have a aspx-page outside of the GViewerApp application, you need to copy it for your changes to take effect, which leaves you with 2 versions of a file. You can avoid this by creating a symbolic link from your copy to your source :
$fsutil hardlink create DekkingsProfiel.aspx "C:\Users\Stephan\Wrk\sde01_one\Gasunie\Ga

sUnie.NetViewer.Dekkingsprofiel\Pages\DekkingsProfiel.aspx"
Windows now creates a symbolic link to your source-aspx, and it looks like there are 2 seperate aspx-files, but if you edit either one of them both are changed since there’s really only one version. This way, the version in in GViewerApp always matches your development version.
