G/Technology

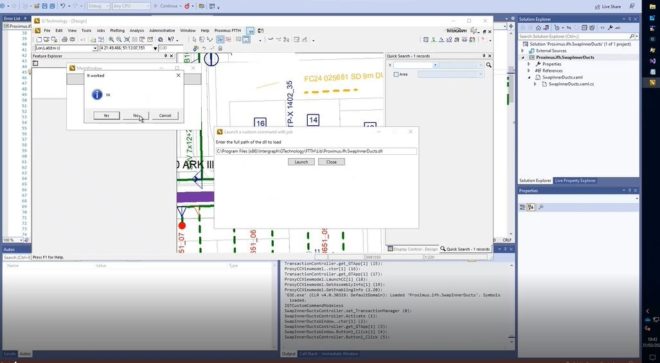
Shortening CustomCommand development time by using a proxy

One of the most time-consuming processes when developing with Hexagon G/Technology is creating custom commands. The usual development approach consists of the following iterative process:

  • Compile custom command
  • Launch G/Technology
  • Test custom command
  • Exit G/Technology
  • Modify custom command
During testing, only limited changes to the source code are allowed by the Visual Studio Edit and Continue function, effectively requiring multiple iterations of this sequence.

The process of starting and closing G/Technology can easiliy takeup multiple minutes and you need to close it because G/Technology will lock any assemblies containing your custom commands.

Customcommands are written in DotNet and therefore run in something called an “Assembly Domain”, in this case the G/Technology Assembly Domain. When you create a custom command loading other custom commands in its own assembly domain, dotnet will not load the same assembly again in fact creating a proxy. The following code snippet demonstrates this:

string assembly = @"c:\Program Files (86)\Intergraph\GTechnology\YourCustomCommand.dll";
byte[] assemblyBytes = File.ReadAllBytes(assembly);
System.Reflection.Assembly assemblyToLoad = Assembly.Load(assemblyBytes);

Type entryClass = assemblyToLoad.GetTypes().FirstOrDefault(t ⇒ typeof(IGTCustomCommandModal).IsAssignableFrom(t));
if( entryClass != null)
{
    IGTCustomCommandModal CCModal = (IGTCustomCommandModal)assemblyToLoad.CreateInstance(entryClass.FullName);
    CCModal.Activate();
    return;
}

entryClass = assemblyToLoad.GetTypes().FirstOrDefault(t ⇒ typeof(IGTCustomCommandModeless).IsAssignableFrom(t));
if( entryClass != null)
{
    IGTCustomCommandModeless CCModeless = (IGTCustomCommandModeless)assemblyToLoad.CreateInstance(entryClass.FullName);
    CCModeless.Activate(_customCommandHelper);
    return;
}

This snippet scans an assembly for a type implementing either interface ‘IGTCustomCommandModal‘ or ‘IGTCustomCommandModeless‘, which both can be found in namespace ‘Intergraph.GTechnology.Interfaces‘ and are needed to implement customcommands. If a type implements one of these interfaces, the proxy customcommand creates an instance of it loading it in the assembly domain.

When this approach is used to load custom commands, G/Technology will not lock the containing assemblies after closing the custom command, enabling much shorter development cycles.

The technique constists of 2 or more custom commands, the first one being the proxy, the second one being the custom command to be developed. Once the first customcommand is started, it will show a dialog where the assembly containing the custom command to be developed should be entered :

Proxy dialog

Some extra querying to the G3E_CUSTOMCOMMAND table allows to provide useful metadata as shown in the pop-up window.

Then attach the Visual Studio debugger and press ‘Launch’ and any breakpoint in your customcommand should be hit and it can be tested. Once done, detach the debugger, modify code, compile and attach again, etc., etc. :

Debugging session active

An example of a session using this technique this can be seen in this this youtube video, showing a debug session of a custom command called “Swap Inner Ducts” which will just show a dialog and a messagebox, but the important part is that the customcommand is changed, recompiled and executed again using the Visual Studio debugger without leaving G/Technology.

Youtube video

Sources can be downloaded from here.

Credits go to Jan Stuckens for initially coming up with this idea.

Thanks to Michaël Demanet and Didier de Bisschop from Proximus for use of their environment to test this technique.

Notes :

  • the proxy needs to be built with debugging information, else breakpoints in the target customcommand won’t be hit
  • All referenced assemblies need to be loaded
  • This technique has been used with assemblies containing a single custom command, assemblies with multiple custom commands where not tested
  • G/Technology version 10.04.2002.00035 was used to test this approach

AdHoc Queries

Fiber Cables

Introduction

G/Technology provides functionality to run dynamic queries, the so called ‘Ad-Hoc queries’. A Large telecom provider in the Netherlands is moving Fiber Cables from CRAMER to FOW and AdHoc-queries provide a great tool to analyze and visualize migrated data

At this provider Fiber Cables are contained by Fiber Inner Ducts who themselves are contained by Fiber Ducts. A fiber Duct has a Tag marked on it a.k.a. B217982 so workers can identify a Duct. Fiber Ducts go from Fiber Branch Enclosure to Fiber Branch Enclosure, Fiber Inner Ducts also do. Fiber Cables go from Fiber Splice Enclosures to Fiber Splice Enclosures. Fiber Branch Enclosures contain Fiber Splice Enclosures. This is illustrated by the following figure:

Fiber Cables

Fiber Cables

Click here for the legend.

This network is registered in 2 systems, CRAMER NIM (CRAMER Network Inventory Management) and GEOS FOW (GTechnology Fiber Optic Works), but Fiber Cables are registered only in NIM. This is illustrated by the next figures:

NIM-GEOS

NIM-GEOS

Fiber Cables are only registred in NIM, not in GEOS FOW. To enable better management of Fiber assets, registration of Fiber Cables need to be moved from NIM to GEOS FOW. Fiber Branch- and Fiber Splice Enclosures have an asset-id which is a number like ‘1001’ Fiber Cables have a name like ‘Hd-Hd 1’. This name is also maintained with Fiber Inner Ducts in NIM and is used to put Fiber Cables from NIM into the right Fiber Inner Duct in GEOS FOW. In the current GEOS FOW system where there are no Fiber Cables (yet) present, this looks like this.
The Fiber Inner Ducts with the Fiber Cable name on it are indicated in red and are contained in a Duct. You can also see that the ‘Contains’-node of the Fiber Inner Ducts do not have a value, but this is where migrated Fiber Cables will appear.

When all these assets are registered correctly, Fiber Cables can be migrated from NIM to FOW. Both systems NIM and GEOS FOW are running for several years so mismatches between the 2 systems exists and not all Fiber Cables can be migrated correctly. To analyze and visualize the quality of migration, Ad-Hoc queries play an important role.

Fiber Inner Ducts without cables

One of the queries giving insight in the data migration has the following requirements: Show all Fiber Ducts with a Fiber Inner Duct in it who don’t have a cable inside it. If the ‘CABLE_NAME’ attribute of these ducts had been set, then they should have a cable inside it and are not reserved stock aka. reserved for future use. In FOW Fiber Inner Ducts (fno=4100) have a ‘Contained By’ relation with Fiber Ducts (fno=4000), and Fiber Cables (fno=7200) also have a ‘Contained By’ relation with Fiber Inner Ducts. Using this relation, the following Ad-Hoc query lists all Fiber Ducts with Fiber Inner Ducts in it without a cable :

select  gc_fduct_l.g3e_fno
	,	gc_fduct_l.g3e_fid
	,	gc_fduct_l.g3e_cno
	,	gc_fduct_l.g3e_cid
	,	a.g3e_fid	fid_inner_duct
	,	gc_netelem.cable_name	
	from gc_contain a
		inner join gc_netelem on gc_netelem.g3e_fid = a.g3e_fid
		inner join gc_fduct_l on gc_fduct_l.g3e_fid = a.g3e_ownerfid
	where a.g3e_fno = 4100
		and a.g3e_ownerfno = 4000
		and gc_netelem.cable_name is not null
		and gc_netelem.g3e_fno = 4100
		and rownum < 100
	and not exists (select g3e_fid from gc_contain b where b.g3e_fno = 7200 and b.g3e_ownerfid = a.g3e_fid)

You can run this query using the ‘Ad Hoc’-query wizard (click here for a video) and after some scrolling the output may look like this :

Basic AdHoc Query

Basic AdHoc Query

The Query Name is added to the ‘Queries’-node in the Legend and the extends of the Netherlands is shown. The query has run successful, and there are many Fiber Inner Ducts without a Fiber Cable in it but we cannot really see them without turning off all the items in the legend and then zooming in into one of the items of the resultset.

Notes:

  • Before creating your first Ad-Hoc query, you need to define an ‘Area Of Interest’
  • We are limiting the output to 100 rows
  • Ad-Hoc queries always need to output at least the following attributes : G3E_FNO, g3E_FID, G3E_CNO & G3E_CID. These attributes enable selection of separate features from the result set and should point to a graphical components for selection in a Map window
  • AdHoc-queries are saved in a Workspace, when creating a new Workspace previous Ad-Hoc are not available
  • When creating AdHoc-queries the feature selected is just a placeholder, but the Wizard only continues to the second screen if you select a feature. Once you have done that you can query any feature
  • You can change the appearance of your result set even after running it using Display Control
  • Save and test your query outside G/Technology for easy development

Avoid joints

While the query used does its work, table GC_FDUCT_L is joined to get the Graphic Lines in the system representing Fiber Ducts. Since the Feature- & Component numbers for this feature don’t change and are required, non-repeating components we can rewrite the query as follows:

select  4000 g3e_fno
	, a.g3e_ownerfid g3e_fid
	, 4010 g3e_cno
	, 1 g3e_cid
	, a.g3e_fid	fid_inner_duct
	, gc_netelem.cable_name	
	from gc_contain a
		inner join gc_netelem on gc_netelem.g3e_fid = a.g3e_fid
	where a.g3e_fno = 4100
		and a.g3e_ownerfno = 4000
		and gc_netelem.cable_name is not null
		and gc_netelem.g3e_fno = 4100
		and rownum < 100
	and not exists (select g3e_fid from gc_contain b where b.g3e_fno = 7200 and b.g3e_ownerfid = a.g3e_fid)

The necessary keys g3e_fno, g3e_cno & g3e_cid are still present but are now created using hardcoded value instead of SQL-joins, only the value for g3e_fid is variable but is now fetched from GC_CONTAIN. In this approach, table GC_FDUCT_L is no longer required.

Output results to a DataTable

This first queries showed we have some problems with our data migration, but the results are not really in a readable format. If you have a query with multiple results like this one, it may be convenient to output the results to a Datatable.

Output to datatable

If you output results to a datatable you can easily do the following:

  • Fit a feature
  • Select a feature in Feature Explorer
  • Export results

Note: If your result set is very large, it is better to export your results using a dedicated SQL-tool.

Custom ‘Areas Of Interest’

When creating an AdHoc-query, you can limit the results to be contained in a predefined area, the so called ‘Areas Of Interest’ (AOI). If you do so, G/Technology will first run a dedicated query to fetch features from your active AOI and then add some dedicated code after your query. If we take our first query:

select  gc_fduct_l.g3e_fno
	,	gc_fduct_l.g3e_fid
	,	gc_fduct_l.g3e_cno
	,	gc_fduct_l.g3e_cid
	,	a.g3e_fid	fid_inner_duct
	,	gc_netelem.cable_name	
	from gc_contain a
		inner join gc_netelem on gc_netelem.g3e_fid = a.g3e_fid
		inner join gc_fduct_l on gc_fduct_l.g3e_fid = a.g3e_ownerfid
	where a.g3e_fno = 4100
		and a.g3e_ownerfno = 4000
		and gc_netelem.cable_name is not null
		and gc_netelem.g3e_fno = 4100
	and not exists (select g3e_fid from gc_contain b where b.g3e_fno = 7200 and b.g3e_ownerfid = a.g3e_fid)

will be changed to:

select  gc_fduct_l.g3e_fno
	,	gc_fduct_l.g3e_fid
	,	gc_fduct_l.g3e_cno
	,	gc_fduct_l.g3e_cid
	,	a.g3e_fid	fid_inner_duct
	,	gc_netelem.cable_name	
	from gc_contain a
		inner join gc_netelem on gc_netelem.g3e_fid = a.g3e_fid
		inner join gc_fduct_l on gc_fduct_l.g3e_fid = a.g3e_ownerfid
	where a.g3e_fno = 4100
		and a.g3e_ownerfno = 4000
		and gc_netelem.cable_name is not null
		and gc_netelem.g3e_fno = 4100
	and not exists (select g3e_fid from gc_contain b , AOIQUERYRESULT AQR WHERE (GC_FDUCT.G3E_FID = AQR.G3E_FID AND AQR.G3E_USERNAME='GTFIBER' AND AQR.G3E_QUERYNAME='aa') AND (b.g3e_fno = 7200 and b.g3e_ownerfid = a.g3e_fid))

This generates an Oracle error. Creating an Ad-Hoc query using an AOI can be hard to get working, but you can use Oracle Spatial to create your own ‘Areas Of Interest’. This feature is called ‘CLLI Boundary’ is used to create Areas of Interest, but we can also use it in Oracle Spatial to limit our query to only process a given area called ‘Hd-C’:

select  gc_fduct_l.g3e_fno
	,	gc_fduct_l.g3e_fid
	,	gc_fduct_l.g3e_cno
	,	gc_fduct_l.g3e_cid
	,	a.g3e_fid	fid_inner_duct
	,	gc_netelem.cable_name	
	from gc_contain a
		inner join gc_netelem on gc_netelem.g3e_fid = a.g3e_fid
		inner join gc_fduct_l on gc_fduct_l.g3e_fid = a.g3e_ownerfid
		, gc_bnd_p	
	where a.g3e_fno = 4100
		and a.g3e_ownerfno = 4000
		and gc_netelem.cable_name is not null
		and gc_netelem.g3e_fno = 4100
		and gc_bnd_p.feature_type = 'CLLI'		
		and gc_bnd_p.wc_clli = 'Hd-C'
		and not exists (select g3e_fid from gc_contain b where b.g3e_fno = 7200 and b.g3e_ownerfid = a.g3e_fid)
		and SDO_GEOM.RELATE( gc_bnd_p.g3e_geometry, 'ANYINTERACT', gc_fduct_l.g3e_geometry, 0.1) = 'TRUE'

The SDO_GEOM.RELATE Oracle Spatial operator is used in the where clause to get all the Fiber Ducts contained in area ‘Hd-C’.

Finding features with carriage returns in Attribute values

When users are entering attribute values using Feature Explorer they may be expecting G/Technology saving values when entering ‘Enter’. GTech will not do this, but will instead store a Carriage return/Line Feed with the attribute value. This will lead to pollution of attribute values in the database and give mismatches between tag-id’s from ducts coming from NIM and ducts in GTech. During the migration we might for example be looking for two ducts with Tag-id ‘B217982’, but what we find I ‘B217982’ and ‘B217982Chr(10)Chr(13)’. The following Ad-Hoc query will show all Fiber Duct features (fno=4000) who’s cable_name attribute has the ‘CHR(13)CHR(10)’ character combination (CHR(13)=Carriage Return, CHR(10)=Line Feed) :

select g3e_fno
     , g3e_fid
	 , g3e_cno
	 , g3e_cid
	 , cable_name
from gc_netelem	
where gc_netelem.g3e_fno = 4000
and regexp_like( trim(cable_name), CHR (13) || CHR(10) )

Click here for a Video of creating and running this Query.

Hope this Helps. Stephan

Debugging G/Technology 10.2 with Visual Studio

In an earlier post Stephan mentions that it was not possible to debug G/Technology 10.2 in “edit and continue” mode. You could only attach Visual Studio to the G3E.exe and debug. But you cannot break the code and then make a small change. For every change you need to close G3E.exe, compile your project, start G3E.exe and attach Visual Studio again. When you try to start-up the 10.2 G3E.exe in debugging mode from Visual Studio we got the following error message:

Exception start debugging g3e.exe from visualstudio

But here is the way to do that. The first thing you have to do is adjust the G3E.exe.config located in the \GTechnology\Program directory. You should add the following three lines  after the <configuration> tag.

<?xml version="1.0?" encoding="utf-8" ?>
<configuration>
  <startup useLegacyV2RuntimeActivationPolicy="true">
    <supportedRuntime version="v2.0.50727"/>
  </startup>

After that you must adjust the Path-variable. Or check if the path is already set in you system settings. The following path needs to exist in the path variable for a 64bit environment it is: C:\Program Files (x86)\Common Files\Intergraph. If you are using a 32bit environment you should lose the (x86) part.

Set the path variable

After setting the path, it is important to reboot the machine! Now you can fully debug your applications in Visual Studio.

If you are not an administrator on you machine and cannot change the path variable for some reason, you could also add the path to your working folder in Visual Studio. But if you have multiple projects defined in Visual Studio, you should change this for all projects.

Debug, without admin rights

Debugging Netviewer serverside pages

If you need to build server side pages in Netviewer, changes are likely that you want to debug them. First thing to do is to change the output-path of your assembly to C:\Program Files\Intergraph\GTechnology\Program\GViewerApp\bin like in the following figure:

Visual Studio output path

This figure shows the properties page of a project, and while the path isn’t complete visible, it should be C:\Program Files\Intergraph\GTechnology\Program\GViewerApp\bin, the bin folder of your application. Next step to do is make sure that the aspx-page in the GViewerApp folder matches the one in your project. You can either copy it or even better create a symbolic link to your original source using the fsutil command (see notes for an example). If you now start a debug session using F5, your breakpoints won’t be hit because you are using the Visual Studio built in webserver which uses an url like http://localhost:1399/ and Netviewer is using IIS. You can check the url netviewer client is using is by entering a string like http://G01/GViewer directly into Internet Explorer, where G01 should be replaced by your server. If you entered the right url, the following screen shows up :

Intergraph Netviewer client url from Internet Explorer

netviewer from ie

If you then select ‘OK’, Netviewer client will start. In order to debug your serverside pages, you need to attach the debugger to the process which is serving http://G01/GViewer. This is process ‘w3pw.exe’ running with credentials as set in your application pool :

Intergraph Netviewer application pool

Netviewer application pool

The process to attach to is the w3wp.exe executable running with the credentials as set in the IIS application pool :

Visual Studio attach to process

Attach to process

As you can see, the username matches the identity in my application pool which is G01\Stephan. If you now start a debug session, breakpoints probably won’t be hit because there are some more steps we need to take care off. The next step is enable debugging in IIS :

Enable debugging Internet Information Services Windows Server 2003

Enable debugging IIS

This figure shows the ‘Configuration’ dialog of the GViewer-IIS node. You can reach this by opening Internet Information Services (IIS), right mouse click the GViewer Virtual Directory, select the ‘Virtual Directory’-tab and then select the ‘Configuration’-tab which shows the ‘Application Configuration’ dialog. Make sure you select both checkboxes in the ‘Debugging flags’ section.
We also need to let ASP.Net compile webpages with debugging enabled. For IIS, ASP.Net is just a plugin to handle pages with an .aspx extension and it’s configuration is apart from IIS. In order for ASP.Net to generate debugging symbols when your pages are compiled, you need to add the following line to Web.Config located in
C:\Program Files\Intergraph\GTechnology\Program\GViewerApp, just after the system.web node:

<system.web>
  <compilation debug="true" />
</system.web>

Debugging should now work. If you select button ‘Attach’ from the ‘Attach to process’ screen, invoke a clientside function which posts back to your server page your breakpoints should be hit :

Breakpoint hit Netviewer aspx page

Breakpoint hit Netviewer aspx page

The ‘Single File Page’ model

One thing which also might help is to develop your ASPX-pages with all your server-side code in the aspx page itself. That way, you don’t need to place a custom dll in the GViewerApp bin folder and temper with it. This technique is called the Single File Page Model, an aspx-page using this technique looks like this :

<%@ Page Language="C#" %>

<script type="text/C#" runat="server">
    protected void Page_Load(object sender, EventArgs e)
    {
        System.Diagnostics.Debug.WriteLine("Page_Load");
    }

    protected void Button1_Click(object sender, EventArgs e)
    {
        this.Label1.Text = "Netviewer Rocks!";
    }
</script>
<html xmlns="http://www.w3.org/1999/xhtml">
<head runat="server">
    <title></title>
</head>
<body>
    <form id="form1" runat="server">
    <div>
    
    </div>
        <asp:Button ID="Button1" runat="server" OnClick="Button1_Click" Text="Button" />
        <asp:Label ID="Label1" runat="server" Text="Label"></asp:Label>
    </form>
</body>
</html>

You need to place this file in the GViewerApp folder. If you now attach Visual Studio to process ‘w3wp.exe’ and open your .aspx file, your breakpoints will be hit :

Breakpoint hit single file model Intergraph Netviewer server

Breakpoint hit single file model

In my experience, that’s the most convenient way to debug ASPX pages. You just need to place the .aspx-page in the GViewerApp folder, attach Visual Studio to the w3wp.exe process and you’re ready to go. You can also change code in the aspx without having to restart the server, ASP.Net will recompile it runtime.

Troubleshooting

  • If using the code-behind model, you might need to restart GNetviewer for the breakpoints to be hit and to be able to overwrite files in the GViewerApp\bin folder
  • If the process ‘w3pw.exe’ doesn’t show up in the process list and Netviewer is started, there is no session yet. You need to start Netviewer client for new HTTP requests to be send to IIS which will start a new worker process ‘w3wp.exe’. This is your new session.
  • In order to quickly see if your breakpoints are hit, you can enter a url like http://g01/GViewer/QuickSearch.aspx directly in Internet Explorer. If you then select a button causing a postback and your environment is setup right, breakpoints are hit and you can step through your code
  • When attaching the debugger, you may need to select the type of code to debug. Visual Studio doesn’t always select the right type :
    Select code type to debug

    Select code type to debug

  • If you have a aspx-page outside of the GViewerApp application, you need to copy it for your changes to take effect, which leaves you with 2 versions of a file. You can avoid this by creating a symbolic link from your copy to your source :
    $fsutil hardlink create DekkingsProfiel.aspx "C:\Users\Stephan\Wrk\sde01_one\Gasunie\Ga
    sUnie.NetViewer.Dekkingsprofiel\Pages\DekkingsProfiel.aspx"

    Windows now creates a symbolic link to your source-aspx, and it looks like there are 2 seperate aspx-files, but if you edit either one of them both are changed since there’s really only one version. This way, the version in in GViewerApp always matches your development version.

Validating a ConnectionConfigurationMap.ccm file : ccmReader

When setting up a G/Technology environment, one of the boring things always is getting your ConnectionConfigurationMap.ccm right. One way to see what ddc-file is causing you trouble is use sysinternals Process Monitor tool and see what the last ddc-file read by the G3E-executable was. The next file immediately following that file in your ConnectionConfigurationMap.ccm then is the cause of your problem. This approach works but is very boring and can take a lot of time. Therefore, I created a tool called ‘ccmReader’ which stands for ConnectionConfigurationMap Reader and its soal purpose is to check the validness of a ConnectionConfigurationMap.ccm file.

CcmReader’s usage is as follows :


ccmReader [-v] [-l] [-c CONF] [-dumplang] [-showlang] [-help] ConnectionConfigurationMap.ccm

So what does it do ? Let’s say you have the following ConnectionConfigurationMap.ccm section and the F152-DetailVerwijzing.ddc file is missing:


MAPFILE=d:MAPFILESGEOSDDC9.4F148-Oov.ddc;
MAPFILE=d:MAPFILESGEOSDDC9.4F159-Waterkruising.ddc;
MAPFILE=d:MAPFILESGEOSDDC9.4F152-DetailVerwijzing.ddc;
MAPFILE=d:MAPFILESGEOSDDC10.1F252-InfraLand.DDC;
MAPFILE=d:MAPFILESGEOSDDC10.1F252-InfraLand_1.DDC;

CcmReader then would output the following :

DDC file is missing

DDC file is missing

The output tells you that there are two files which should be present according to the ConnectionConfigurationMap.ccm file but could not be read : d:MAPFILESGEOSDDC9.4F152-DetailVerwijzing.ddc and d:MAPFILESGEOSDDC9.4F152-DetailVerwijzing.cdt. So without even trying to start G/Designer, Netviewer or G/Netplot you know it will not work since your configuration is wrong and you need to fix it. Once you have corrected the errors and each file can be found, the tool will not output anything unless you used the verbose (-v) flag :

Verbose option

Verbose option

I use this tool very often in my day-to-day work, and it comes in very handy.

You can download the executable here.

Hope this helps, Stephan