Deploying an MVC4 Web application to Windows 2003

I had a hard time deploying an MVC4 application to Windows server 2003, so I thought I’d share my experience with you.
When deploying an MVC4-based website to Windows Server 2003, it is important to add Wildcard maps in Internet Information Services (IIS). The default IIS-configuration is based on extensions coupled to ISAPI-addins, but MVC doesn’t work with extensions so you need to tell IIS to have a ‘catch-it all’ extension. Here are the steps necessary to do so.

The target framework needs to be 4.0

If you develop a MVC4 website using Visual Studio 2012, the default .NET framework is 4.5. Windows 2003 doesn’t support the .NET framework 4.5 as you can read over here, so you need to downgrade the target framework to 4.0. You can easily do this with Visual Studio 2012 by changing the target framework in your project properties pages :

Target framework Visual Studio 2012 project

Target framework Visual Studio 2012 project

Installing the .Net 4 framework

The next step is to install the .NET framework 4.0. This comes in two flavours, the .NET 4 Framework Client Profile and the .NET 4 Framework which is the full framework. If you are deploying webapplications, you need the full framework, the Client Profile is a subset of the framework for desktop applications. You can read more about the differences over here. You can download the full redistributable of the .Net framework 4.0 at microsoft. After you installed the .NET 4.0 framework, you’ll see the following listing in installed programs :

.NET 4 framework installed

.NET 4 framework installed

The .NET 4 Framework Client Profile is the subset of the framework, the .NET 4 Framework Client Extended is the remainder making the full framework to be installed.

Configuring IIS to use .Net 4

After .NET 4 is installed, it is registered to IIS as an Web Service Extension, but it is not enabled by default:

ASP.Net 4.0 prohibited

ASP.Net 4.0 prohibited

Right click the ASP.Net v4.0.30319 line and select Allowed. After that, you should see the following screen :
ASP.Net 4.0 allowed

ASP.Net 4.0 allowed

Adding a Wildcard map

If you are deploying Web-Forms applications, then your done and your application should run. If you are working on MVC applications there’s one last step to do, you need to add a Wildcard map for your application. Go to IIS, select your project and choose Properties→Virtual Directory→Configuration and you’ll see the Application Configuration screen. In the lower part you can see a listing of installed wild card application maps, which is empty. You can add one by selecting the ‘Insert’ button:

Insert wildcard IIS map Virtual Directory

Insert wildcard map IIS Virtual Directory


The ‘Add/Edit Application Extension Mapping’ dialog shows up. In the Executable-text field, enter the path to the .NET Framework 4.0 isapi-extension which is normally c:\Windows\Microsoft.NET\Framework\v4.0.30319\aspnet_isapi.dll. Be sure to unselect the ‘Verify that file exist’-checkbox :

Add IIS wildcard

Add IIS wildcard


Choose ‘OK’ and close the screen. Your dialog should now look like this :
IIS Wildcard added

IIS Wildcard added


Close the screen, and your MVC4 application should now be ready to run!

Increasing G/Netviewer performance

Note: The monitoring and tests are done on G/Netviewer 9.4 environment. But I think it is also applicable for version 10.

After some in-depth monitoring of our G/Netviewer webserver for some days/weeks. We found a performance enhancement for G/Netviewer webserver. Our server has 4 cores and 8GB memory. On our environment there are 25 to 30 concurrent users working with G/Netviewer. When we measured the CPU time in the working hours, the statistics shown that the average CPU time was round 35% and users are complaining about performance. When we monitored the server, there are on average 5 mapserver.exe running and we specified that there can be 10 maximum, but it never reaches 10.

Also our statistics show there is almost no paralleled processing of the mapserver.exe. The data shows that mapservers are randomly fired after the other process is done. Mapserver1 processing something, then mapserver2, then mapserver1 again, then mapserver3, etc.  You should expect when there are 4 mapservers.exe, those executables will fire all at once if 4 users doing a Zoom-action within G/Netviewer, but it doesn’t. Sometime we do see that 2 mapserver.exe do simultaneously fire. Or when a extra new mapserver.exe is starting then it will process the modificationlog table in parallel processing. So the server can upscale to 10 mapservers and we would expect 80% CPU time, but that is not what happening.

In our environment we do have two G/Netviewer groups (Database users) specified in the G3E_loginmapping table. (In G/Tech 10 this table is not used anymore and everything is stored in IAM database) A quarter of the total users is specified in the g3e_loginmapping table and are mapped to an advanced usergroup. All other users are mapped to default usergroup. So we have only two usergroups and two mapserver.exe processing parallel….hmm. What if we created more usergroups, would G/Netviewer do more parallel processing. The answer is YES.

The G/Netviewer webserver processing does work like a supermarket. The GNWebMgr.exe is the store manager, Mapserver.exe is a checkout lane and the a netviewer group is the cashier. In our situation we had only two cashiers working on two lanes. When the shop got more busier, the queue are getting larger and the manager opens another lane. But there are no extra cashiers, so the cashiers need to switch between lanes.  When you define more groups in the g3e_loginmapping table you get more cashiers, so more parallel processing.

What you have to do is specify all frequent users in the g3e_loginmapping table and map those users to different groups. In the webcc.web_user table you van get information which users are logged in. But every time they login the Last_license_access date will be overwritten. So you can monitor this for example once per day, for one/two weeks. To get most frequent users and divide them over different groups.

Debugging G/Technology 10.2 with Visual Studio

In an earlier post Stephan mentions that it was not possible to debug G/Technology 10.2 in “edit and continue” mode. You could only attach Visual Studio to the G3E.exe and debug. But you cannot break the code and then make a small change. For every change you need to close G3E.exe, compile your project, start G3E.exe and attach Visual Studio again. When you try to start-up the 10.2 G3E.exe in debugging mode from Visual Studio we got the following error message:

Exception start debugging g3e.exe from visualstudio

But here is the way to do that. The first thing you have to do is adjust the G3E.exe.config located in the \GTechnology\Program directory. You should add the following three lines  after the <configuration> tag.

<?xml version="1.0?" encoding="utf-8" ?>
<configuration>
  <startup useLegacyV2RuntimeActivationPolicy="true">
    <supportedRuntime version="v2.0.50727"/>
  </startup>

After that you must adjust the Path-variable. Or check if the path is already set in you system settings. The following path needs to exist in the path variable for a 64bit environment it is: C:\Program Files (x86)\Common Files\Intergraph. If you are using a 32bit environment you should lose the (x86) part.

Set the path variable

After setting the path, it is important to reboot the machine! Now you can fully debug your applications in Visual Studio.

If you are not an administrator on you machine and cannot change the path variable for some reason, you could also add the path to your working folder in Visual Studio. But if you have multiple projects defined in Visual Studio, you should change this for all projects.

Debug, without admin rights

Debugging Netviewer serverside pages

If you need to build server side pages in Netviewer, changes are likely that you want to debug them. First thing to do is to change the output-path of your assembly to C:\Program Files\Intergraph\GTechnology\Program\GViewerApp\bin like in the following figure:

Visual Studio output path

This figure shows the properties page of a project, and while the path isn’t complete visible, it should be C:\Program Files\Intergraph\GTechnology\Program\GViewerApp\bin, the bin folder of your application. Next step to do is make sure that the aspx-page in the GViewerApp folder matches the one in your project. You can either copy it or even better create a symbolic link to your original source using the fsutil command (see notes for an example). If you now start a debug session using F5, your breakpoints won’t be hit because you are using the Visual Studio built in webserver which uses an url like http://localhost:1399/ and Netviewer is using IIS. You can check the url netviewer client is using is by entering a string like http://G01/GViewer directly into Internet Explorer, where G01 should be replaced by your server. If you entered the right url, the following screen shows up :

Intergraph Netviewer client url from Internet Explorer

netviewer from ie

If you then select ‘OK’, Netviewer client will start. In order to debug your serverside pages, you need to attach the debugger to the process which is serving http://G01/GViewer. This is process ‘w3pw.exe’ running with credentials as set in your application pool :

Intergraph Netviewer application pool

Netviewer application pool

The process to attach to is the w3wp.exe executable running with the credentials as set in the IIS application pool :

Visual Studio attach to process

Attach to process

As you can see, the username matches the identity in my application pool which is G01\Stephan. If you now start a debug session, breakpoints probably won’t be hit because there are some more steps we need to take care off. The next step is enable debugging in IIS :

Enable debugging Internet Information Services Windows Server 2003

Enable debugging IIS

This figure shows the ‘Configuration’ dialog of the GViewer-IIS node. You can reach this by opening Internet Information Services (IIS), right mouse click the GViewer Virtual Directory, select the ‘Virtual Directory’-tab and then select the ‘Configuration’-tab which shows the ‘Application Configuration’ dialog. Make sure you select both checkboxes in the ‘Debugging flags’ section.
We also need to let ASP.Net compile webpages with debugging enabled. For IIS, ASP.Net is just a plugin to handle pages with an .aspx extension and it’s configuration is apart from IIS. In order for ASP.Net to generate debugging symbols when your pages are compiled, you need to add the following line to Web.Config located in
C:\Program Files\Intergraph\GTechnology\Program\GViewerApp, just after the system.web node:

<system.web>
  <compilation debug="true" />
</system.web>

Debugging should now work. If you select button ‘Attach’ from the ‘Attach to process’ screen, invoke a clientside function which posts back to your server page your breakpoints should be hit :

Breakpoint hit Netviewer aspx page

Breakpoint hit Netviewer aspx page

The ‘Single File Page’ model

One thing which also might help is to develop your ASPX-pages with all your server-side code in the aspx page itself. That way, you don’t need to place a custom dll in the GViewerApp bin folder and temper with it. This technique is called the Single File Page Model, an aspx-page using this technique looks like this :

<%@ Page Language="C#" %>

<script type="text/C#" runat="server">
    protected void Page_Load(object sender, EventArgs e)
    {
        System.Diagnostics.Debug.WriteLine("Page_Load");
    }

    protected void Button1_Click(object sender, EventArgs e)
    {
        this.Label1.Text = "Netviewer Rocks!";
    }
</script>
<html xmlns="http://www.w3.org/1999/xhtml">
<head runat="server">
    <title></title>
</head>
<body>
    <form id="form1" runat="server">
    <div>
    
    </div>
        <asp:Button ID="Button1" runat="server" OnClick="Button1_Click" Text="Button" />
        <asp:Label ID="Label1" runat="server" Text="Label"></asp:Label>
    </form>
</body>
</html>

You need to place this file in the GViewerApp folder. If you now attach Visual Studio to process ‘w3wp.exe’ and open your .aspx file, your breakpoints will be hit :

Breakpoint hit single file model Intergraph Netviewer server

Breakpoint hit single file model

In my experience, that’s the most convenient way to debug ASPX pages. You just need to place the .aspx-page in the GViewerApp folder, attach Visual Studio to the w3wp.exe process and you’re ready to go. You can also change code in the aspx without having to restart the server, ASP.Net will recompile it runtime.

Troubleshooting

  • If using the code-behind model, you might need to restart GNetviewer for the breakpoints to be hit and to be able to overwrite files in the GViewerApp\bin folder
  • If the process ‘w3pw.exe’ doesn’t show up in the process list and Netviewer is started, there is no session yet. You need to start Netviewer client for new HTTP requests to be send to IIS which will start a new worker process ‘w3wp.exe’. This is your new session.
  • In order to quickly see if your breakpoints are hit, you can enter a url like http://g01/GViewer/QuickSearch.aspx directly in Internet Explorer. If you then select a button causing a postback and your environment is setup right, breakpoints are hit and you can step through your code
  • When attaching the debugger, you may need to select the type of code to debug. Visual Studio doesn’t always select the right type :
    Select code type to debug

    Select code type to debug

  • If you have a aspx-page outside of the GViewerApp application, you need to copy it for your changes to take effect, which leaves you with 2 versions of a file. You can avoid this by creating a symbolic link from your copy to your source :
    $fsutil hardlink create DekkingsProfiel.aspx "C:\Users\Stephan\Wrk\sde01_one\Gasunie\Ga
    sUnie.NetViewer.Dekkingsprofiel\Pages\DekkingsProfiel.aspx"

    Windows now creates a symbolic link to your source-aspx, and it looks like there are 2 seperate aspx-files, but if you edit either one of them both are changed since there’s really only one version. This way, the version in in GViewerApp always matches your development version.

Validating a ConnectionConfigurationMap.ccm file : ccmReader

When setting up a G/Technology environment, one of the boring things always is getting your ConnectionConfigurationMap.ccm right. One way to see what ddc-file is causing you trouble is use sysinternals Process Monitor tool and see what the last ddc-file read by the G3E-executable was. The next file immediately following that file in your ConnectionConfigurationMap.ccm then is the cause of your problem. This approach works but is very boring and can take a lot of time. Therefore, I created a tool called ‘ccmReader’ which stands for ConnectionConfigurationMap Reader and its soal purpose is to check the validness of a ConnectionConfigurationMap.ccm file.

CcmReader’s usage is as follows :


ccmReader [-v] [-l] [-c CONF] [-dumplang] [-showlang] [-help] ConnectionConfigurationMap.ccm

So what does it do ? Let’s say you have the following ConnectionConfigurationMap.ccm section and the F152-DetailVerwijzing.ddc file is missing:


MAPFILE=d:MAPFILESGEOSDDC9.4F148-Oov.ddc;
MAPFILE=d:MAPFILESGEOSDDC9.4F159-Waterkruising.ddc;
MAPFILE=d:MAPFILESGEOSDDC9.4F152-DetailVerwijzing.ddc;
MAPFILE=d:MAPFILESGEOSDDC10.1F252-InfraLand.DDC;
MAPFILE=d:MAPFILESGEOSDDC10.1F252-InfraLand_1.DDC;

CcmReader then would output the following :

DDC file is missing

DDC file is missing

The output tells you that there are two files which should be present according to the ConnectionConfigurationMap.ccm file but could not be read : d:MAPFILESGEOSDDC9.4F152-DetailVerwijzing.ddc and d:MAPFILESGEOSDDC9.4F152-DetailVerwijzing.cdt. So without even trying to start G/Designer, Netviewer or G/Netplot you know it will not work since your configuration is wrong and you need to fix it. Once you have corrected the errors and each file can be found, the tool will not output anything unless you used the verbose (-v) flag :

Verbose option

Verbose option

I use this tool very often in my day-to-day work, and it comes in very handy.

You can download the executable here.

Hope this helps, Stephan

G/Technology & Microsoft security patch July 2012

Installing Microsoft Security Patches for july 2012 on a machine where G/Technology Netviewer server is installed may lead to problems. This has been confirmed  by Intergraph at the Intergraph Customer support website:

Support Notice
Microsoft Security Patches for July 2012
July 19, 2012

Based on Intergraph SG&I’s Quality Assurance testing of the Microsoft Security Patches for July 2012 we have identified some issues when running the G/Technology suite of products in conjunction with these patches. At this time we don’t recommend G/Technology customers installing the July 2012 Microsoft Security Patches. We will update the Support website with additional details as soon as this problem is resolved.

For more information about Microsoft’s July 2012 updates, refer to the following website:http://technet.microsoft.com/en-us/security/bulletin/ms12-jul

If you have any questions, please contact the Intergraph – SG&I Help Desk at 1-877-822-8921 for assistance.

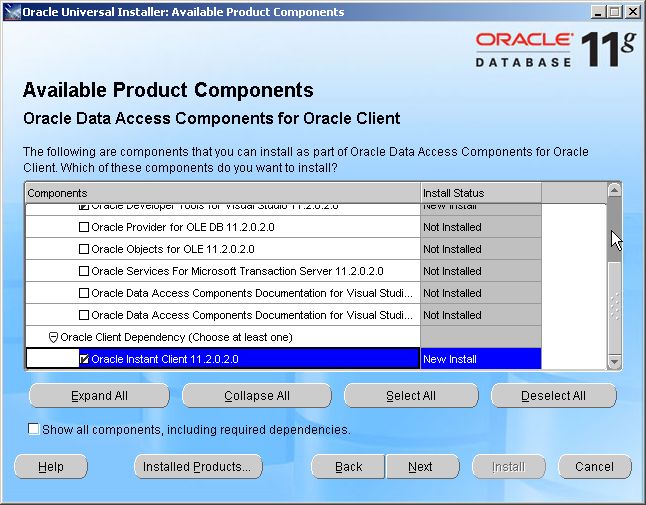
Debugging Oracle PL/SQL from Visual Studio

Product components (lower part)

I use TOAD for my day-to-day Oracle development, but I find it’s debugging experience very poor compared to Visual Studio. Using ODP.Net version 11 you can use Visual Studio to debug Oracle PL/SQL. Here’s how to do it.

First you need to install ‘Oracle Data Access Components for Oracle Client 11.2.0.2.1’ or higher. You can download this from Oracle and you should get file ODTwithODAC112021.zip. Extract the file and double click setup.exe. After this, you’ll see the following screen :

Oracle Data Access Components for Oracle Client 11.2.0.2.1

Oracle Data Access Components for Oracle Client 11.2.0.2.1

Select ‘Oracle Data Access Components for Oracle Client 11.2.0.2.1’ as done in the screen and select ‘Next’. The ‘Available Product Components’-screen shows up :

Product components (upper part)

Product components (upper part)

Product components (lower part)

Product components (lower part)


You only need so select the following :

  • Oracle Data Provider for .Net 11.2.0.2.0
  • Oracle Developer Tools for Visual Studio 11.2.0.2.0
  • Oracle Instant Client 11.2.0.2.

Note:You probably don’t need the ‘Oracle Instant Client’ since you already got sqlplus, but the installer won’t let you deselect it. Select next and let the software install.

After you have installed it, you need to modify the new installed tnsnames.ora which is empty. I just created a symbolic link from to my original tnsnames.ora, that way I only need to maintain one (1) single tnsnames.ora. You can create junctions with the mklink windows command or the junction tool from sysinternals.

Once this is done, you should be able to debug Oracle PL/SQL code using Visual Studio.

I have installed a local Oracle XE database with a G/Technology instance on it, and I want to step through package GPTUtils.PostProcess (‘COMPONENT’).

Connect to your server

From within Visual Studio 2010, open Server Explorer (View->Server Explorer)  and right mouse click ‘Data Connections’ and select the ‘Add Connection’ entry :

Data Connections

The ‘Add Data Connection’-dialog appears. On the ‘Add Data Connection’ dialog, enter the credentials for your Oracle instance and hit ‘Test Connection’ to check it :

Add Dataconnection

After you verified Visual Studio was able to connect to your database, close the ‘Add Data Connection’ dialog and expand the server explorer node with your packages :

Browse packages


Debug GPTUtils.PostProcess

We now want to enter package GPTUtils.PostProcess(‘COMPONENT’) to see what it actually is doing, so I browse to package ‘GPTUtils’, right mouse click method ‘PostProcess’ and select ‘Run debug’. The ‘Run Procedure’-dialog appears enabling you to enter arguments. Enter ‘COMPONENT’ and hit ‘OK’:

Run procedure

Run procedure

A debug session is now started and you can view the call stack, set breakpoints, evaluate variables and use Visual Studio keyboard shortcuts :

GPTUtils.PostProcess (‘COMPONENT’) debugged

‘DBMS_OUTPUT.PUT_LINE’ statements are written to your output window, but they not immediately visible and you need to select the right output. Despite this, I find the Visual Studio debugging experience much more better and productive compared to TOAD’s one.

Some additional notes :

  • To be able to debug your PL/SQL code, you need to have it compiled with debug information. If you haven’t, Visual Studio will ask you to do this.
  • You need to have a static ipadress. I used the Micosoft Loopback adapter.
  • Any existing Oracle connections will need to be recreated

My software configuration looks like this :

  1. Windows 7 64 bit
  2. Oracle11R2g XE 32 bit (file OracleXE112_Win32.zip)
  3. Visual Studio 10 Service pack 1
  4. ODP.Net 11.2.0.3, 32 bits (file ODTwithODAC112021.zip)