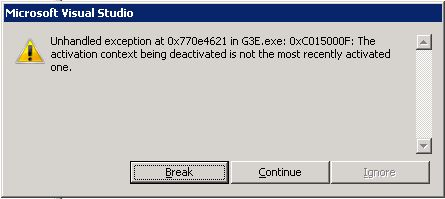
In an earlier post Stephan mentions that it was not possible to debug G/Technology 10.2 in “edit and continue” mode. You could only attach Visual Studio to the G3E.exe and debug. But you cannot break the code and then make a small change. For every change you need to close G3E.exe, compile your project, start G3E.exe and attach Visual Studio again. When you try to start-up the 10.2 G3E.exe in debugging mode from Visual Studio we got the following error message:

But here is the way to do that. The first thing you have to do is adjust the G3E.exe.config located in the \GTechnology\Program directory. You should add the following three lines after the <configuration> tag.
<?xml version="1.0?" encoding="utf-8" ?>
<configuration>
  <startup useLegacyV2RuntimeActivationPolicy="true">
    <supportedRuntime version="v2.0.50727"/>
  </startup>
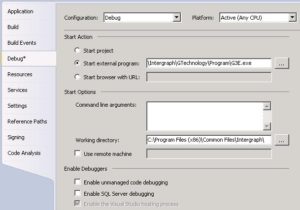
After that you must adjust the Path-variable. Or check if the path is already set in you system settings. The following path needs to exist in the path variable for a 64bit environment it is: C:\Program Files (x86)\Common Files\Intergraph. If you are using a 32bit environment you should lose the (x86) part.

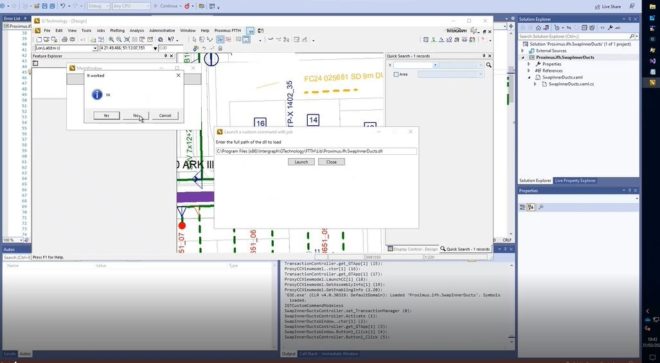
After setting the path, it is important to reboot the machine! Now you can fully debug your applications in Visual Studio.
If you are not an administrator on you machine and cannot change the path variable for some reason, you could also add the path to your working folder in Visual Studio. But if you have multiple projects defined in Visual Studio, you should change this for all projects.


