May 2012

Debugging Oracle PL/SQL from Visual Studio

Product components (lower part)

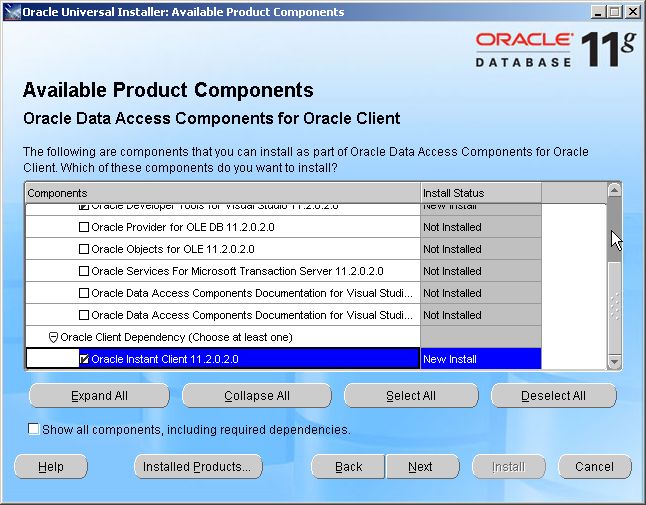
I use TOAD for my day-to-day Oracle development, but I find it’s debugging experience very poor compared to Visual Studio. Using ODP.Net version 11 you can use Visual Studio to debug Oracle PL/SQL. Here’s how to do it.

First you need to install ‘Oracle Data Access Components for Oracle Client 11.2.0.2.1’ or higher. You can download this from Oracle and you should get file ODTwithODAC112021.zip. Extract the file and double click setup.exe. After this, you’ll see the following screen :

Oracle Data Access Components for Oracle Client 11.2.0.2.1

Oracle Data Access Components for Oracle Client 11.2.0.2.1

Select ‘Oracle Data Access Components for Oracle Client 11.2.0.2.1’ as done in the screen and select ‘Next’. The ‘Available Product Components’-screen shows up :

Product components (upper part)

Product components (upper part)

Product components (lower part)

Product components (lower part)


You only need so select the following :

  • Oracle Data Provider for .Net 11.2.0.2.0
  • Oracle Developer Tools for Visual Studio 11.2.0.2.0
  • Oracle Instant Client 11.2.0.2.

Note:You probably don’t need the ‘Oracle Instant Client’ since you already got sqlplus, but the installer won’t let you deselect it. Select next and let the software install.

After you have installed it, you need to modify the new installed tnsnames.ora which is empty. I just created a symbolic link from to my original tnsnames.ora, that way I only need to maintain one (1) single tnsnames.ora. You can create junctions with the mklink windows command or the junction tool from sysinternals.

Once this is done, you should be able to debug Oracle PL/SQL code using Visual Studio.

I have installed a local Oracle XE database with a G/Technology instance on it, and I want to step through package GPTUtils.PostProcess (‘COMPONENT’).

Connect to your server

From within Visual Studio 2010, open Server Explorer (View->Server Explorer)  and right mouse click ‘Data Connections’ and select the ‘Add Connection’ entry :

Data Connections

The ‘Add Data Connection’-dialog appears. On the ‘Add Data Connection’ dialog, enter the credentials for your Oracle instance and hit ‘Test Connection’ to check it :

Add Dataconnection

After you verified Visual Studio was able to connect to your database, close the ‘Add Data Connection’ dialog and expand the server explorer node with your packages :

Browse packages


Debug GPTUtils.PostProcess

We now want to enter package GPTUtils.PostProcess(‘COMPONENT’) to see what it actually is doing, so I browse to package ‘GPTUtils’, right mouse click method ‘PostProcess’ and select ‘Run debug’. The ‘Run Procedure’-dialog appears enabling you to enter arguments. Enter ‘COMPONENT’ and hit ‘OK’:

Run procedure

Run procedure

A debug session is now started and you can view the call stack, set breakpoints, evaluate variables and use Visual Studio keyboard shortcuts :

GPTUtils.PostProcess (‘COMPONENT’) debugged

‘DBMS_OUTPUT.PUT_LINE’ statements are written to your output window, but they not immediately visible and you need to select the right output. Despite this, I find the Visual Studio debugging experience much more better and productive compared to TOAD’s one.

Some additional notes :

  • To be able to debug your PL/SQL code, you need to have it compiled with debug information. If you haven’t, Visual Studio will ask you to do this.
  • You need to have a static ipadress. I used the Micosoft Loopback adapter.
  • Any existing Oracle connections will need to be recreated

My software configuration looks like this :

  1. Windows 7 64 bit
  2. Oracle11R2g XE 32 bit (file OracleXE112_Win32.zip)
  3. Visual Studio 10 Service pack 1
  4. ODP.Net 11.2.0.3, 32 bits (file ODTwithODAC112021.zip)